I've built a home weather station out of three major components:
- An Arduino, which connects to the various sensors and provides a general-purpose, programmable platform I can easily enhance and extend. Data from the sensors is averaged and reported periodically through the Arduino's serial port interface.
- An OLED display, which shows current sensor readings. A push button associated with the display allows toggling through a series of screens so that however much data is relevant and interesting can be reviewed by the user.
- A Raspberry Pi, which connects to the Arduino via USB both to power the Arduino and allow reading the sensor data as it is reported by the Arduino. The Raspberry Pi connects to my home network so data can be uploaded from the weather station. It also provide housekeeping services such as logging all the data received, restarting everything properly if power goes out, and generating reports on daily readings which are relayed to me via email.
Here's how everything comes together:
The Arduino and Sensors
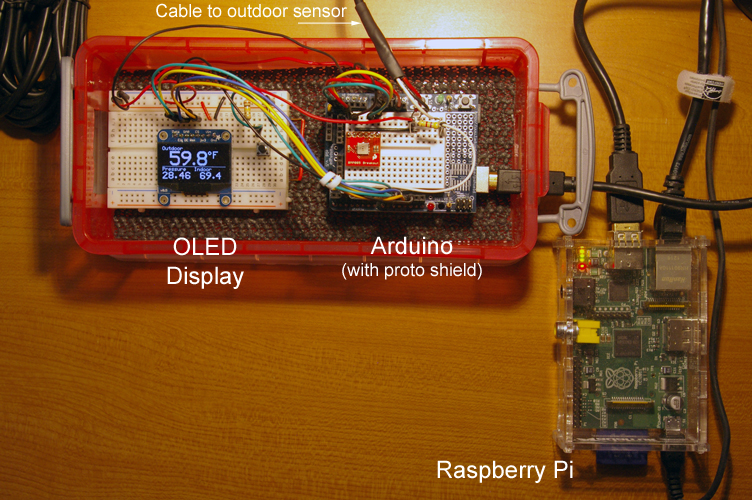
The Arduino's primary role is to communicate with the sensors, average the data over a five minute period, and report the averaged values for upload to the Internet. Currently there are two sensors, a Dallas Semiconductor (now Maxim) DS18B20 digital temperature sensor packaged on in a waterproof housing at the end of a 36" cable, and a BMP085 digital pressure sensor capable of measuring both barometric pressure and temperature. The DS18B20 is used to measure temperature outside my house (by feeding the cable out a nearby window), and the BMP085 reports both indoor temperature and barometric pressure (which is the same inside and outside, naturally).
As you can see in the picture above a prototyping shield is attached to the Arduino and the BMP085 is installed on the breadboard area of the proto shield. A USB cable leads from the Arduino to the Raspberry Pi. And several wires connect to a separate breadboard bearing the OLED Display.
The OLED Display
The first version of my weather station used a simple LCD character display capable of showing two lines of sixteen characters each. That just didn't turn out to be enough room for all the various sensor readings plus high/low values, etc. I thought about adding a pushbutton so I could step through multiple screens on the LCD but came across an inexpensive 128x64 pixel-mode OLED display that was low power, better looking, and flexible enough to let me do fancy things like display data in variety of character sizes as well as even draw graphs of data trends over time.
Using the OLED meant I had to create my own font as the only a small 5x7 character set was built into the OLED library. Also, the OLED uses an in-memory array to drive the pixels on the screen so between that and defining some medium and large characters I had to spend quite a bit of time managing memory usage in my Arduino code. (That's a subject worthy of a separate article, so I won't go into it here.)
The Raspberry Pi
Using a Raspberry Pi wasn't part of my original plan. I figured I might use a Arduino networking shield to get weather station data uploaded to the Internet, either by adding it to the Arduino managing the sensors, or perhaps by using an additional Arduino as the network relay. About the time I got the basic sensor subsystem working, however, I received one of the first batches of Raspberry Pi units to become available and decided its built-in network capabilities plus multi-tasking environment made it a much better choice to upload data and manage weather station operations.
Python is the programming language of choice for Raspberry Pi and it was easy to create a script that could read data from the Arduino via the USB serial connection and properly format that data for upload to the Internet. Cosm.com met the needs for my data cloud and additional Python libraries made that easy. (Recently Cosm.com relaunched as Xively.com with a new set of data APIs, along with a Python SDK so that's where my weather station data is going today.)
I've written some additional Python scripts to generate daily reports of high and low temperature readings and to send me those reports via email. Some simple shell scripts enable starting and stopping the weather station interface and integrating it properly into system start-up and shutdown so the weather station comes up automatically when there's a power failure (which happens several times at our house as we live in a rural location).
Viewing the Data
Every five minutes a data packate containing indoor temperature, outdoor temperature, and barometric pressure is sent to Xively.com and stored there. Xively supports the concept of a feed made up of one or more data streams, so I've defined my weather station overall as a feed and each of the three sensors as streams. While Xively provides a web-based management console that includes simple views of data from feeds and streams I decided I'd rather have my own web application to do that. Xively provides a Javascript SDK that makes it easy to discover data about a connected device and to query data from the streams.
You'll find my weather station data visualization app here on orangemoose.com.
